Science · Drill 109
Science practice 109
⏱ 00:00
Score
—
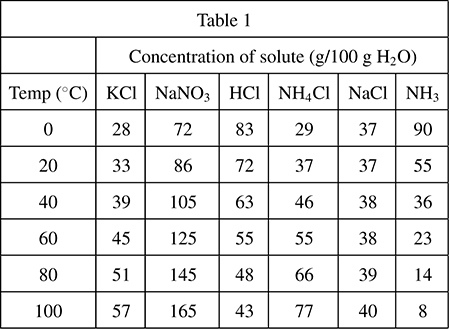
| Table 1 | ||||||
| Concentration of solute (g/100 g H2O) | ||||||
| Temp (°C) | KCl1 | NaNO32 | HCl | NH4Cl | NaCl | NH3 |
| 20 | 28 | 72 | 83 | 29 | 37 | 90 |
| 40 | 33 | 86 | 72 | 37 | 37 | 39 |
| 60 | 39 | 105 | 63 | 46 | 36 | 45 |
| 80 | 125 | 55 | 55 | 51 | ||
| 100 | 145 | 48 | 66 | 57 | ||
| 165 | 43 | 77 | 38 | |||
Based on the data presented in Table 1, answer the following questions:3
As temperature increases from 20°C to 100°C, the solubility of NH34 changes, while other substances show different patterns.5