Science · Drill 114
Science practice 114
⏱ 00:00
Score
—
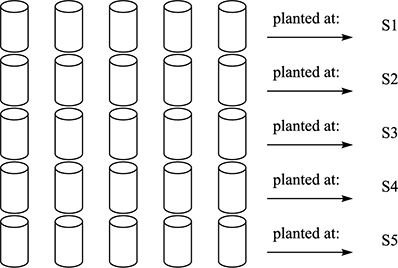
planted at:
planted at:
planted at:
S31
planted at:
planted at:
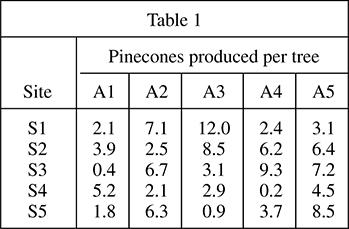
Site
S1
S3
S4
S5
2.1
3.9
0.4
5.2
1.8
Table 1
Pinecones produced per tree
A2
A3
A4
7.1
12.0
2.5
6.7
8.5
2.4
6.2
3.1
2.1
2.9
9.3
0.2
6.3
0.9
3.7
A5
3.1
6.4
7.2
4.5
8.5
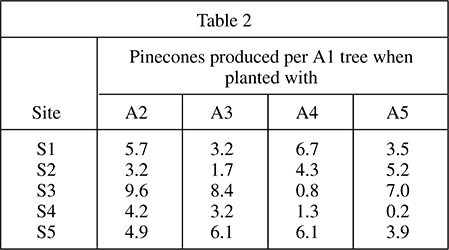
Site
S1
S3
S4
S5
Table 2
Pinecones produced per Al2 tree when
planted with
A2
5.7
3.2
9.6
4.2
4.9
A3
A4
3.2
1.7
6.7
4.3
8.4
0.8
3.2
1.3
6.1
6.1
A5
3.5
5.2
7.0
0.2
3.9
3456