Workspace Science Test 115
← Back to Science
Science · Drill 115

Science practice 115

5 questions ~9 min recommended
00:00
Score
I appreciate you providing this content, but I need to clarify an important limitation: The passage you've provided consists entirely of **graphs and a data table** — there is no running text with underlined portions and standalone digit markers for me to process. The instruction system I follow is designed to: 1. Take OCR'd **text passages** with embedded question markers (standalone digits) 2. Identify underlined phrases based on those markers and the answer options 3. Render them as HTML with `` and `` tags Since your passage contains only: - 
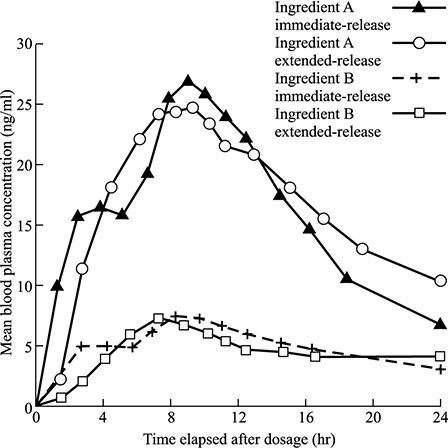
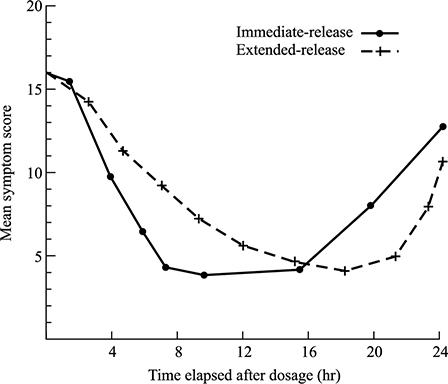
Two line graphs (blood plasma concentration and symptom score over time) - 
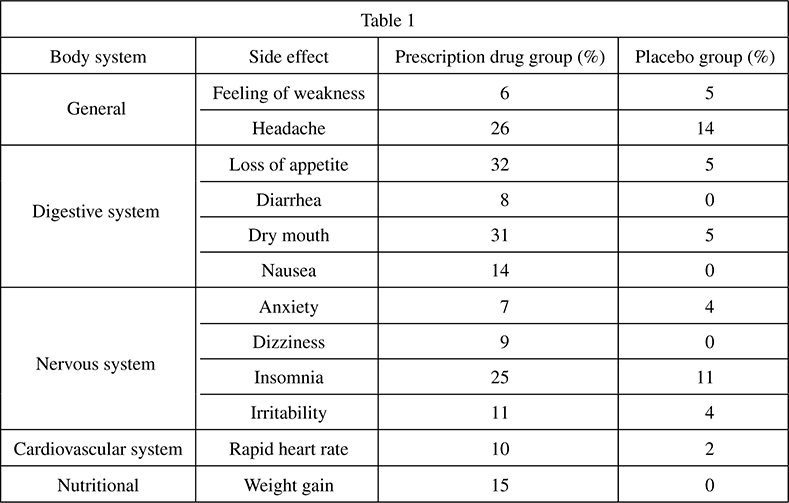
One data table (side effects comparison) - No prose text with underlined segments There are no underlined phrases to mark up, and no standalone digits embedded in text to convert to subscript question numbers. **If you have an actual ACT English passage** (reading comprehension with underlined text portions), please provide that, and I'll render it in the requested HTML format.

Researchers conducted trials on a certain prescription drug delivered in immediate-release capsules and extended-release capsules.

Figure 1 shows the mean concentration (nanograms per milliliter [ng/mL]) of the two active ingredients of the prescription drug in patients' blood plasma over time (hr).

Figure 1

In clinical trials of the prescription drug, subjects given the prescription drug were interviewed at regular intervals about the symptoms the prescription drug is meant to relieve. After each interview, the subjects were assigned a symptom score. A high symptom score corresponds to high intensity of symptoms, and a low symptom score indicates low intensity of symptoms. Figure 2 shows the mean symptom score over time (hr) for subjects who took the prescription drug.

Figure 2

In the clinical trials, some subjects were given the prescription drug and some subjects were given a placebo (an inactive pill). Table 1 shows the percentage of subjects from both groups who reported various adverse side effects.

1. According to Figure 1, 16 hours after taking the extended-release form of the prescription drug, the difference in mean blood plasma concentration between Ingredient A and Ingredient B is closest to:

2. Based on the data in Figures 1 and 2, the researchers should make which of the following conclusions about the overall change in mean blood plasma concentration and mean symptom score over time following dosage?

3. According to Figure 1, mean blood plasma concentration of Ingredient A administered in immediate-release form increases most during which of the following time periods?

4. Which of the following conclusions about adverse side effects caused by the prescription drug is consistent with the results shown in Table 1?

5. The symptom score of a clinical trial subject given the immediate-release form of the prescription drug remained relatively unchanged for 8 hours. Based on Figure 2, the 8-hour period most likely began: