Workspace Science Test 119
← Back to Science
Science · Drill 119

Science practice 119

6 questions ~9 min recommended
00:00
Score
I appreciate you providing this material, but I need to clarify an important issue: **The passage you've provided consists entirely of two graphs and a table with scientific data about velocity, falling balls, and mountain peak heights.** There is no continuous prose text to format into HTML paragraphs. Additionally, **the questions (Q1–Q6) do not match the passage content at all.** The questions reference: - 
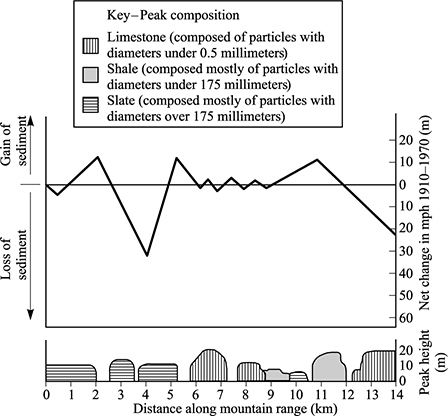
Slate, shale, and limestone peaks - Particle properties - Mountain snowfall - Sediment composition But the passage contains only: - A velocity vs. time graph for falling balls (with and without air resistance) - 
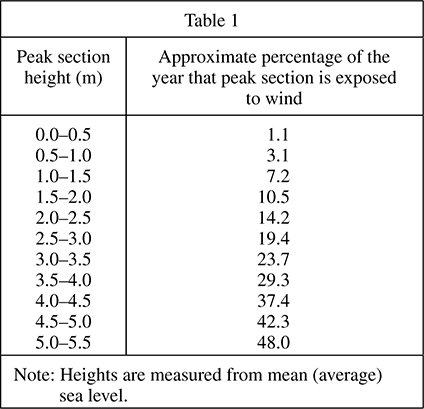
A data table about peak section heights from sea level **To help you, I need:** 1. **The actual prose passage** that accompanies these figures (if this is from an ACT Reading or Science section, there should be written text before/after the graphics) 2. **Confirmation that the questions match** the passage you want formatted Could you provide the complete passage text with any OCR'd question markers (the standalone digits indicating underlined portions)?

The peaks of mountains often lose sediment due to wind erosion. Figure 1 shows mountain peak compositions, mountain heights, in meters (m), and the net change in meters (m), in mean peak height (MPH) from 1910 to 1970 along a section of the Rocky Mountains. A net negative change in MPH indicates a net loss of sediment and a net positive change in MPH indicates a gain of sediment.

Figure 1

Table 1 shows the approximate percentage of a year that horizontal sections of a mountain are exposed to wind.

Figure 2 shows Peak C and D erosion rates, in m/y, as they relate to percentage of a year that mountain peak section is exposed to wind.

Figure 2

1. According to Figure 1, at a distance of 9 km along the mountain range, peaks of what composition are present, if any?

2. According to the information in Figure 1, which of the following properties was used to distinguish the various materials that compose the peaks in the study area?

3. Based on the information listed in Table 1, a peak section with a height of 5.25 m would be exposed to wind approximately what percentage of a year?

4. According to Table 1 and Figure 2, the difference between Peak C and Peak D erosion rates could best be explained as a difference in the:

5. According to Table 1, which of the following figures best represents the relationship between the height of a peak section and the percentage of a year that peak section is exposed to wind erosion?

6. According to information in the passage, wind erosion often results in: