Science · Drill 121
Science practice 121
⏱ 00:00
Score
—
Day
Day 1
Day 2
Day 3
Day 4
Day 1
Day 2
Day 3
Day 4
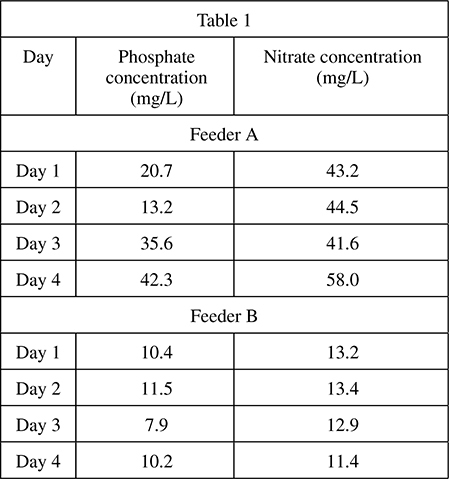
Table 1
| Day | Feeder A | Feeder B | ||
| Phosphate concentration (mg/L) | Nitrate concentration (mg/L) | Phosphate concentration (mg/L) | Nitrate concentration (mg/L) | |
| Day 1 | 20.7 | 43.2 | 10.4 | 13.2 |
| Day 2 | 13.2 | 44.5 | 11.5 | 13.4 |
| Day 3 | 35.6 | 41.6 | 7.9 | 12.9 |
| Day 4 | 42.3 | 58.0 | 10.2 | 11.4 |
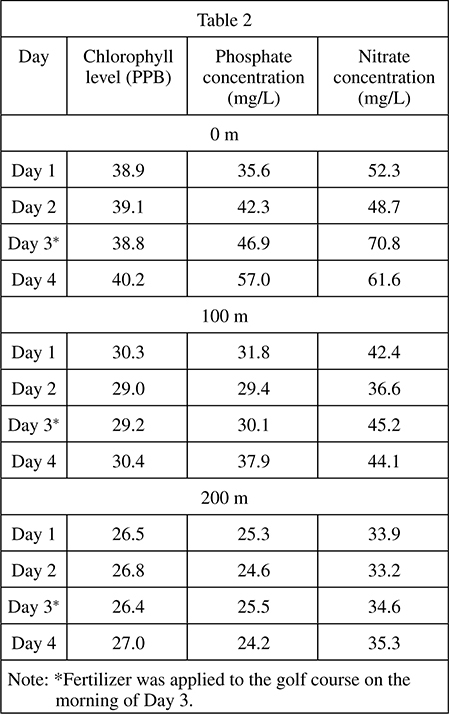
Table 2
| Day | Chlorophyll level (PPB) | Phosphate concentration (mg/L) | Nitrate concentration (mg/L) |
| 0 m | |||
| Day 1 | 38.9 | 35.6 | 52.3 |
| Day 2 | 39.1 | 42.3 | 48.7 |
| Day 3* | 38.8 | 46.9 | 70.8 |
| Day 4 | 40.2 | 57.0 | 61.6 |
| 100 m | |||
| Day 1 | 30.3 | 31.8 | 42.4 |
| Day 2 | 29.0 | 29.4 | 36.6 |
| Day 3* | 29.2 | 30.1 | 45.2 |
| Day 4 | 30.4 | 37.9 | 44.1 |
| 200 m | |||
| Day 1 | 26.5 | 25.3 | 33.9 |
| Day 2 | 26.8 | 24.6 | 33.2 |
| Day 3* | 26.4 | 25.5 | 34.6 |
| Day 4 | 27.0 | 24.2 | 35.3 |
Note: *Fertilizer was applied to the golf course on the morning of Day 3.