Workspace Science Test 129
← Back to Science
Science · Drill 129

Science practice 129

6 questions ~9 min recommended
00:00
Score

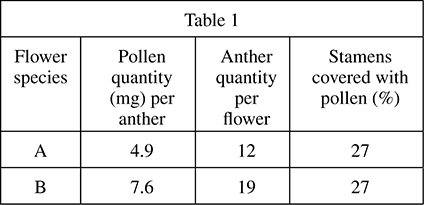
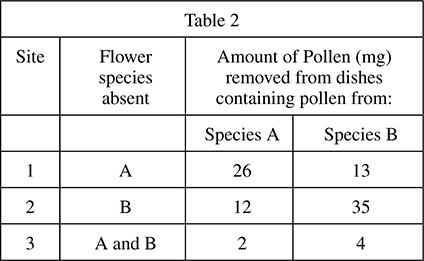
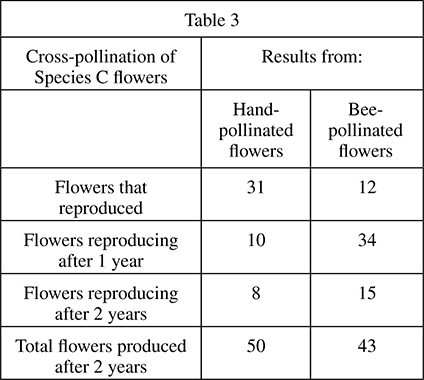
Flower species A Pollen quantity (mg) per anther 4.9 7.6 Table 1 Anther quantity per flower 12 19 Stamens covered with pollen (%) 27 27 Site 1 2 3 Flower species absent A A and B Table 2 Amount of Pollen (mg) removed from dishes containing pollen from: Species A Species B 26 13 12 35 2 4 Table 3 Cross-pollination of Species C flowers Flowers that reproduced Flowers reproducing after 1 year Flowers reproducing after 2 years Total flowers produced after 2 years Results from: Hand- pollinated flowers 31 Bee- pollinated flowers 12 10 34 8 15 50 43

123456

Certain species of flowers attract more bees than others with their pollen. The pollen is found on a structure within the flower called the anther, which is located on top of another structure called the stamen. Flowers typically have multiple anthers and stamens.

Bees carry the pollen from the flowers on their legs. The bees move from flower to flower while collecting pollen. Some of the pollen falls from their legs as the bees land on another flower. This depositing of pollen causes cross-pollination to occur (fertilization of the other flowers). Three studies were conducted to study this process.

Study 1

For two flower species (A and B), pollen quantity per anther in milligrams (mg), anther quantity per flower in number, and percentage of stamens covered with pollen were recorded (see Table 1).

Study 2

Three study sites were established to determine the pollen collection rate of one species of bee for the flowers used in Study 1. In Site 1, Species A flowers were absent. In Site 2, Species B flowers were absent. In Site 3, both Species A and B flowers were absent.

Two pollen containers were placed at each site: one containing 50 mg Species A pollen and one containing 50 mg Species B pollen. The containers were left in place for 36 hours and the amount of pollen that was taken from the containers was measured. The results are recorded in Table 2.

Study 3

The researchers hand-pollinated flowers from a third species, Species C. They also observed the Species C plants being cross-pollinated by the bees in the area. All flowers were observed for 2 years. The scientists recorded the results in Table 3.

1. Based on the results of Study 3, one could generalize that compared to flowers pollinated by hand, flowers pollinated by bees resulted in:

2. Which of the following variables was controlled in the design of Study 2?

3. According to the results of the studies, Species A and Species B are most similar in that their:

4. In Study 2, Site 3 was used to study the:

5. Which of the following is a weakness in the design of Study 2?

6. The results of Study 2 suggest that which of the following factors most affects the flower preference of bees?